Problem
There are so many prices, the oscillation is gargantic.
I want to be able to detect areas where my bot could have succeeded, such that I can analyse patterns which would let my bot make the right decision for a trade.
So I first need to “detect” such areas, and then I need to find out “where” in my data points those areas are.
Approach
First I tried Numbers, an Excel-like spreadsheet application which comes with every Mac. While for a small amount of numbers I created the perfect solution, for large amount of numbers to analyse the process slows down, drastically.
So I had to rethink. Why not use the data from the database directly?
That basically meant I need a tool to display the chart from data from the database, and I needed a simple responsive web server.
There’s lots of such tools. I decided to go with Google tools, check out the Guides and the References part.
I did find the perfect tool, yet it was very poorly documented and thus I had to start low. Remember “De- complexify problems”
- do everything manually, use manual (hard coded data)
var data = new google.visualization.arrayToDataTable([
[‘Opening Move’, ‘Percentage’],
[“King’s pawn (e4)”, 44],
[“Queen’s pawn (d4)”, 31],
[“Knight to King 3 (Nf3)”, 12],
[“Queen’s bishop pawn (c4)”, 10],
[‘Other’, 3]
]);
notice the “true” parameter, it says: no column headers
data = new google.visualization.arrayToDataTable(dataFromDB, true)
now I had data, but no column titles
so I changed my result from db to include column headers
rows.unshift({ “price”: “price”, “id”: “id” })
response.json(rows);
but then I had to change that parameter to false
data = new google.visualization.arrayToDataTable(dataFromDB, false)
- now the table was too long and didn’t scroll
I figured after long looking and testing, there’s options you can pass to the view
var optionsTable = {
width: 265,
chartArea: { ‘width’: ‘100%’, ‘height’: ‘65%’ },
page: ‘enabled’,
pageSize: 40,
allowHtml: true,
}
the “page” parameter does it, the result looks like this
2 things were missing:
I need to be able to page data, like fetch a 1000, then fetch another thousand
I wanted to “interact” with the chart
So for the “paging” mechanism I built to buttons which would fetch the “next” or the “prev” page of data, page being a defined number of rows
the two buttons
<button onclick=“javascript:getPage(‘prev’)“>Load Previous Page</button>
<button onclick=“javascript:getPage(‘next’)“>Load Next Page</button>
the code being called
function getPage(direction) {
var scriptUrl = “/data?direction=” + direction;
$.ajax({
url: scriptUrl,
type: ‘get’,
dataType: ‘html’,
async: false,
success: function (data) {
myJson = JSON.parse(data)
let myArray = myJson.map(obj => Object.values(obj));
dataFromDB = myArray;
}
});
drawSort()
}
the code on the server being executed, see the “next” / “prev” actions, how this influences the paging (page++ or page–) from the db, see the limit clause
else if (action == undefined) {
sql = `SELECT price ,id from ${table} limit ${page * 500}, 1000`;
db.all(sql, (err, rows) => {
if (err) {
console.error(err.message);
}
rows.unshift({ “price”: “price”, “id”: “id” })
response.json(rows);
});
} else if (action == “next”) {
page++
sql = `SELECT price, id from ${table} limit ${page * 500}, 1000`;
db.all(sql, (err, rows) => {
if (err) {
console.error(err.message);
}
rows.unshift({ “price”: “price”, “id”: “id” })
response.json(rows);
});
} else if (action == “prev”) {
page–
sql = `SELECT price, id from ${table} limit ${page * 500}, 1000`;
db.all(sql, (err, rows) => {
if (err) {
console.error(err.message);
}
rows.unshift({ “price”: “price”, “id”: “id” })
response.json(rows);
});
}
But how about “interaction” with the chart? Turns out, you can select points by default. But I wanted more, guess what, there’s options = {} too you can supply to the chart view. You can supply options to zoom in, to reset, for tick marks on the scale and you can turn on multiple selections.
var options = {
width: 1000, height: 800,
chartArea: { ‘width’: ‘80%’, ‘height’: ‘80%’ },
selectionMode: ‘multiple’,
explorer: { actions: [‘dragToZoom’], maxZoomIn: .01, keepInBounds: true },
}
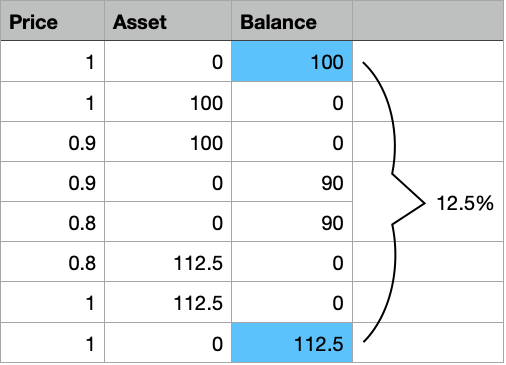
So far so good, but I wanted to do something with that info. As a first step, I intercepted the clicked points, made sure only 2 can be selected, and I changed the tooltip, which per default was info from the table. Now I wanted the tooltip to show percentage change from the first point clicked.
After a lot of testing I figured it out.
google.visualization.events.addListener(chart, ‘select’, selectHandler);
// make sure we only have 2 points selected
var selectedPoints = []
function selectHandler(e) {
selectedPoints = chart.getSelection()
var selectedItem = chart.getSelection()[selectedPoints.length – 1];
if (selectedItem) {
// make sure we only have 2 points selected, delete one if we select 3
if (2 < selectedPoints.length) {
selectedPoints.pop()
selectedPoints.pop()
selectedPoints.push(selectedItem)
chart.setSelection(selectedPoints)
}
// if 1 point is selected, update the tool tips of all others with percentage change related to the first selected point
if (1 == selectedPoints.length) {
for (i = 0; i < dataFromDB.length – 1; i++) {
point1 = data.getValue(selectedPoints[0].row, selectedPoints[0].column)
point2 = data.getValue(i, 1)
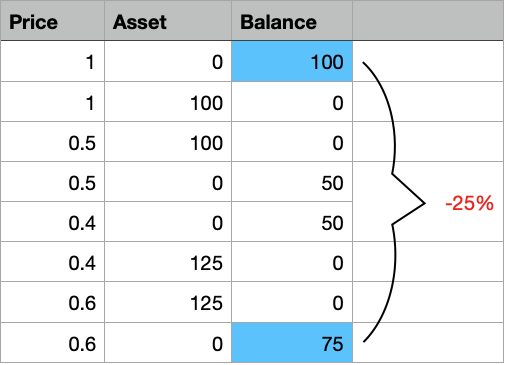
change = (point2 / point1 * 100) – 100
if (0 > change) {
data.setCell(i, 2, `<p style=”font-size:25px; text-align: right”>price: <b>${point2}</b><br><font style=”color:red”>${change.toFixed(2)}%</font></p>`)
} else {
data.setCell(i, 2, `<p style=”font-size:25px; text-align: right”>price: <b>${point2}</b><br>${change.toFixed(2)}%</p>`)
}
}
}
}
}
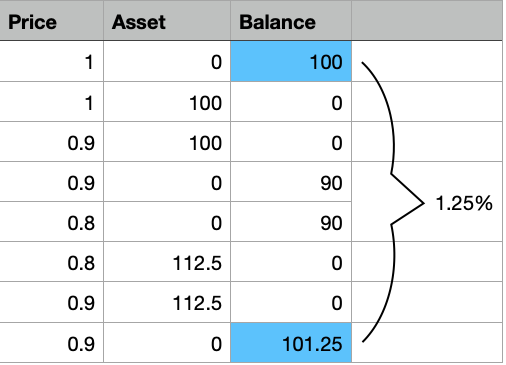
positive change in price
positive change in price
Turns out, that for HTML tooltips I needed to enable in 2 areas the HTML option. I figured this out by accident. You can see this in the code above which shows the options for the chart and here:
data.addColumn({ ‘type’: ‘string’, ‘role’: ‘tooltip’, ‘p’: { ‘html’: true } });
And this is the full prototype
and here it is in action https://youtu.be/DFV3qq-4oIY
Intercept key presses
Problem
I want to be able to mark data points in my database for which I should need to do some deeper analysis. I want to do this via key press (eg <ctrl><s>).
I also want to be able to simpler remove already selected points from the line chart. The “normal” way is clicking them again to unselect them. But this is rather daunting cause you need to be accurate.
Approach
Don’t even bother handling key events yourself. Let jQuery do that for you. It does it nicely, and (hopefully) across all browsers.
$(document).keydown(function (event) {
// <ctrl><s> shall mark the point in the db
if (event.ctrlKey && event.which == 83) {
savePoint()
}
});
Adjusting my line chart
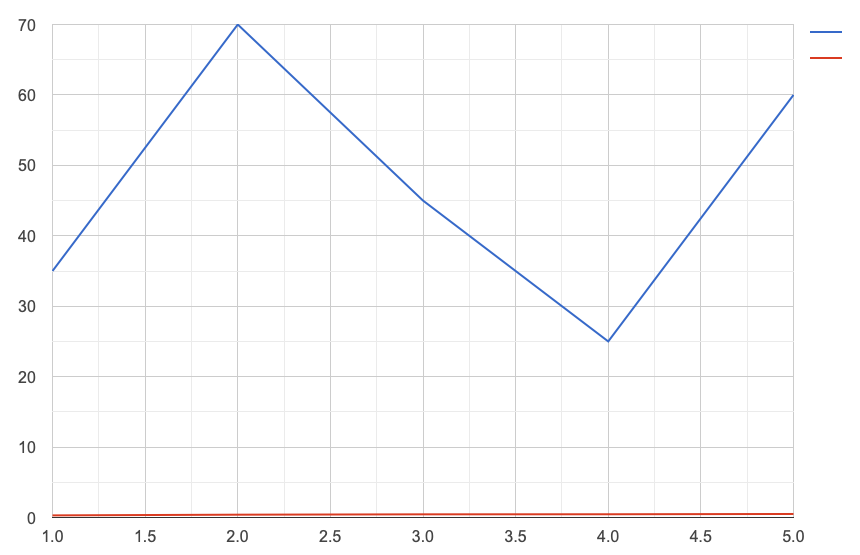
So while I am developing my bot I try to improve its “clairvoyance”, such that he may predict a drop or rise better. So I am introducing additional parameters I want to display in my line chart.
Doesn’t help a lot if the red line is squeezed to the bottom due to having totally different values than the blue line.
After hours of searching I figured these settings in the display options of the chart help.
series: {
0: { targetAxisIndex: 0 },
1: { targetAxisIndex: 1 }
}, vAxes: {
0: {
minValue: 20, maxValue: 70
}, 1: {
minValue: 0.2, maxValue: 0.7
}
},
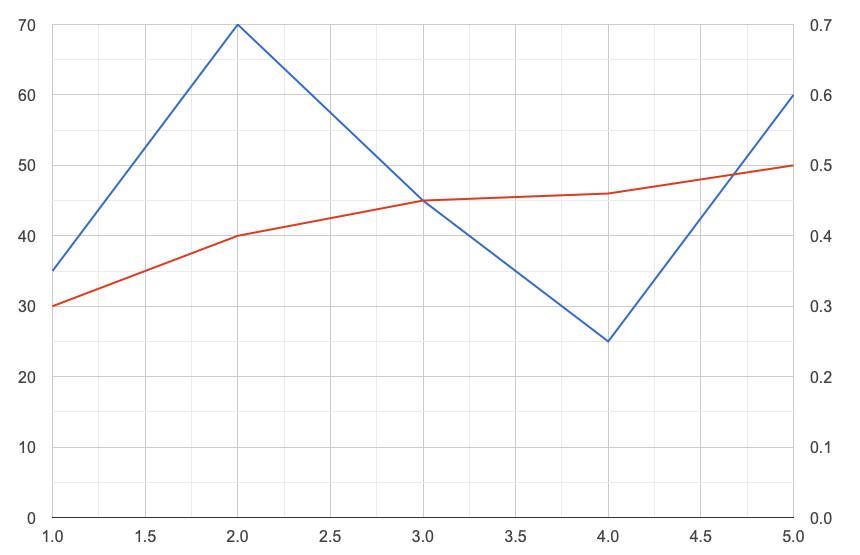
Result
series: {
0: { targetAxisIndex: 1 },
1: { targetAxisIndex: 0 }
}, vAxes: {
1: {
minValue: 20, maxValue: 70
}, 0: {
minValue: 0.2, maxValue: 0.7
}
},
How to zoom-out of a chart
Zooming in in Google charts is a breeze. You just need to set the appropriate option, see chapter “Create a tool to visually analyse data”.
But if you want to zoom out step by step it’s a bit more complicated. But I found some code from the same guy (
https://stackoverfow.com/users/5090771/whitehat) from whom I “stole” already the code to “reset” the zoom level in case I need a redraw, which I do if I click a point and I need to change all tooltips.
So the new piece of code is this here:
var container = document.getElementById(‘chart_sort_div’)
google.visualization.events.addListener(chart, ‘ready’, function () {
zoomLast = getCoords();
//zoomCoords.push(zoomLast)
var observer = new MutationObserver(function () {
zoomCurrent = getCoords();
if (JSON.stringify(zoomLast) !== JSON.stringify(zoomCurrent)) {
zoomCoords.push(zoomLast)
zoomLast = getCoords();
console.log(‘zoom event’);
}
});
observer.observe(container, {
childList: true,
subtree: true
});
})
chart.draw(viewChart, options);
Pay attention to the “container” variable!
And this is also needed for the right click not to reset, but to zoom out:
function zoomOut() {
options.hAxis.viewWindow = {};
options.vAxis.viewWindow = {};
coords = zoomCoords.pop()
if (coords) {
options.hAxis.viewWindow.min = coords.x.min;
options.hAxis.viewWindow.max = coords.x.max;
options.vAxis.viewWindow.min = coords.y.min;
options.vAxis.viewWindow.max = coords.y.max;
}
viewChart.setColumns(axesToDisplay)
chart.draw(viewChart, options);
}
and a global variable
and that’s it! Again, so simple
Adding a slider to move between pages of data
I first had added a prev/next page button. But since then my data has grown and I need to be able to move faster than click 100 times the next button.
How about using a “slider” like this
Fortunately jQuery UI has a slider tool as standard. The normal slider doesn’t show the value, so how do you know where you are? Easy! There’s a “slide” event on the slider, use it to read the current “value” and set that value as text of the slider element:
<!doctype html>
<html lang=“en”>
<head>
<meta charset=“utf-8”>
<title>slider demo</title>
<link rel=“stylesheet” href=“//code.jquery.com/ui/1.12.1/themes/smoothness/jquery-ui.css”>
<style>
#slider {
margin: 10px;
}
</style>
<script src=“//code.jquery.com/jquery-1.12.4.js”></script>
<script src=“//code.jquery.com/ui/1.12.1/jquery-ui.js”>
</script>
</head>
<body>
<div id=“content”>
<div id=“slider”></div>
</div>
<script>
$(“#slider”).slider();
$(“#slider”).slider(“option”, “max”, 50);
$(“#slider”).slider(“option”, “min”, 10);
sliderHandle = “.ui-slider-handle” //insideHTML
$(“#slider”).on(“slide”, function (event, ui) {
$(sliderHandle).text(ui.value)
});
</script>
</body>
</html>
Now obviously you need to know which tables have how many pages to display. Add something like this to your
server:
app.get(‘/pages’, (request, response) => {
sql = `SELECT count(id) as count from ${table}`;
db.all(sql, (err, rows) => {
if (err) {
console.error(err.message);
}
response.json(rows);
});
})
Make sure you call the “/pages” on load somewhere on the HTML document
var scriptUrl = “/pages” + name;
$.ajax({
url: scriptUrl,
type: ‘get’,
dataType: ‘html’,
async: false,
success: function (data) {
console.log(data)
count = JSON.parse(data)[0].count
pages = Math.ceil(count / 500)
}
});
On slide stop you want to retrieve the actual data page of your db:
$(“#slider”).on(“slidestop”, function (event, ui) {
value = $(“#slider”).slider(“option”, “value”)
console.log(value)
var scriptUrl = “/data?page=” + value;
$.ajax({
url: scriptUrl,
type: ‘get’,
dataType: ‘html’,
async: false,
success: function (data) {
myJson = JSON.parse(data)
let myArray = myJson.map(obj => Object.values(obj));
dataFromDB = myArray;
}
});
drawSort()
});
There’s lots of opportunities to customise further